 Animating charts always seems to come up when talking about desired features when graphing. While animations on charts are often just a whole lot of ~WIZ~ #BANG# FLASH!, they sometimes serve a practical purpose. When trying to stick to a Javascript library this has been a common constraint, particularly on in the Flot library. Yesterday I was reading an article showing data on how movies are getting worse and I was pleasantly surprised to find MooCharts when I checked the source code of the page.
I'm wondering if anyone has used this library and hoping they could share their experience with MooCharts.
| Attachment | Size |
|---|---|
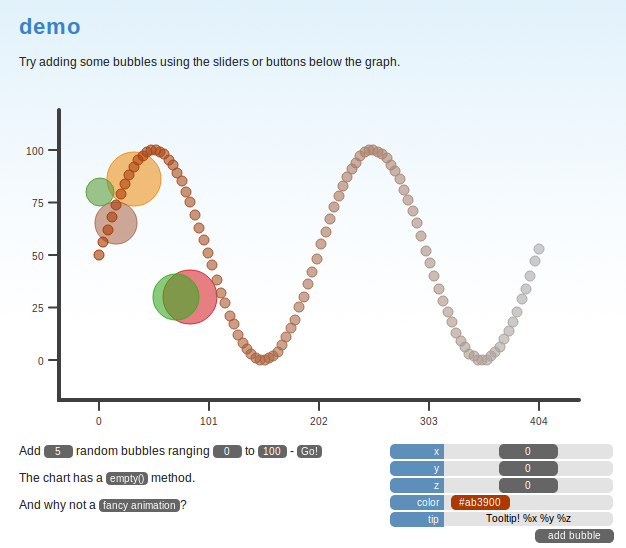
| moocharts-demo.png | 84.7 KB |