 I've just finished setting up the first Beta 1 installation of Sensor Hub and it required me to port a couple months of data from an old alpha installation to the new installation. 26,000 data points that is... While I can use certain Views filters to limit the results for plotting with the Flot Charts module, I would really love to be able to see all of this data in one chart. It's just data from a couple of months afterall. So I could use some various server side algorithms to reduce the amount of points output thus making it a managable for download and rendering on the client side, but I'm starting to get the feeling that the mentioned technique might just end up being a game of spin the bottle *ahem* I mean a game of moving the bottleneck around.
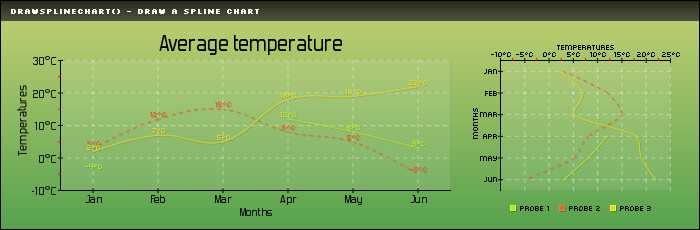
A quick search on open source server side graphing libraries brought up pChart http://www.pchart.net/. Looks pretty spiffy. Anyone have any experience with it?
